Modern software systems are more distributed, dynamic, and complex than ever before. Applications run across containers, virtual machines, serverless functions, and multiple cloud providers—all generating massive volumes of data every second. To keep everything running smoothly, teams rely on observability platforms like Datadog that help them monitor metrics, logs, and traces in real time. These tools go beyond traditional monitoring by giving engineering teams deep visibility into the internal state of their systems.
TLDR: Observability platforms like Datadog allow teams to monitor metrics, logs, and traces from across their infrastructure and applications in one centralized platform. They help identify issues faster, reduce downtime, and improve system performance. By correlating different types of telemetry data, teams gain actionable insights rather than isolated alerts. This article explores how these tools work, why they matter, and how leading platforms compare.
What Is Observability in Modern Systems?
Observability is the ability to understand what is happening inside a system based on the data it produces. Unlike traditional monitoring—which focuses on predefined metrics and alerts—observability enables teams to ask new questions about their systems without deploying new code.
At its core, observability revolves around three primary data types:
- Metrics: Numerical measurements such as CPU usage, memory consumption, request rates, and error rates.
- Logs: Detailed records of system events, application activity, and errors.
- Traces: End-to-end tracking of requests as they move through distributed systems.
Together, these three pillars provide a comprehensive view of application health and performance.
Why Metrics, Logs, and Traces Matter Together
Metrics, logs, and traces each offer unique insights—but their real power lies in correlation.
Imagine a sudden spike in application latency:
- Metrics might reveal a 40% spike in CPU usage.
- Logs could show repeated database timeout errors.
- Traces might identify a slow downstream API call responsible for cascading delays.
With observability platforms like Datadog, teams can pivot seamlessly between these data types. Instead of manually stitching together evidence from multiple tools, engineers can investigate issues from a single, unified dashboard.
Key Features of Platforms Like Datadog
While Datadog is often considered a leader in the space, several platforms provide similar capabilities. Most modern observability solutions share a common set of features:
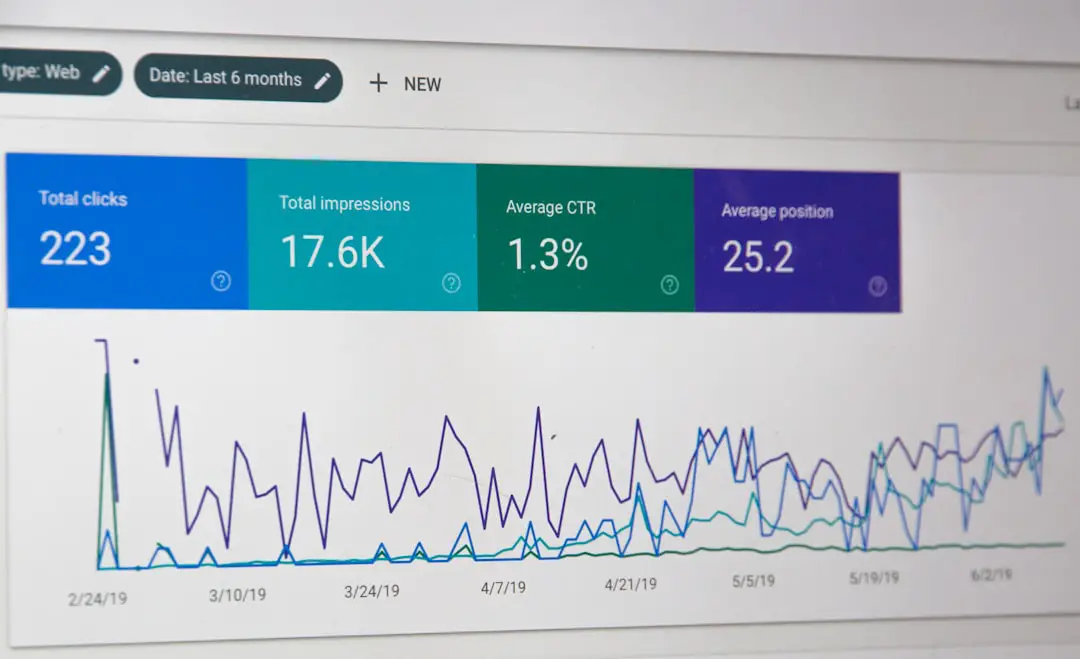
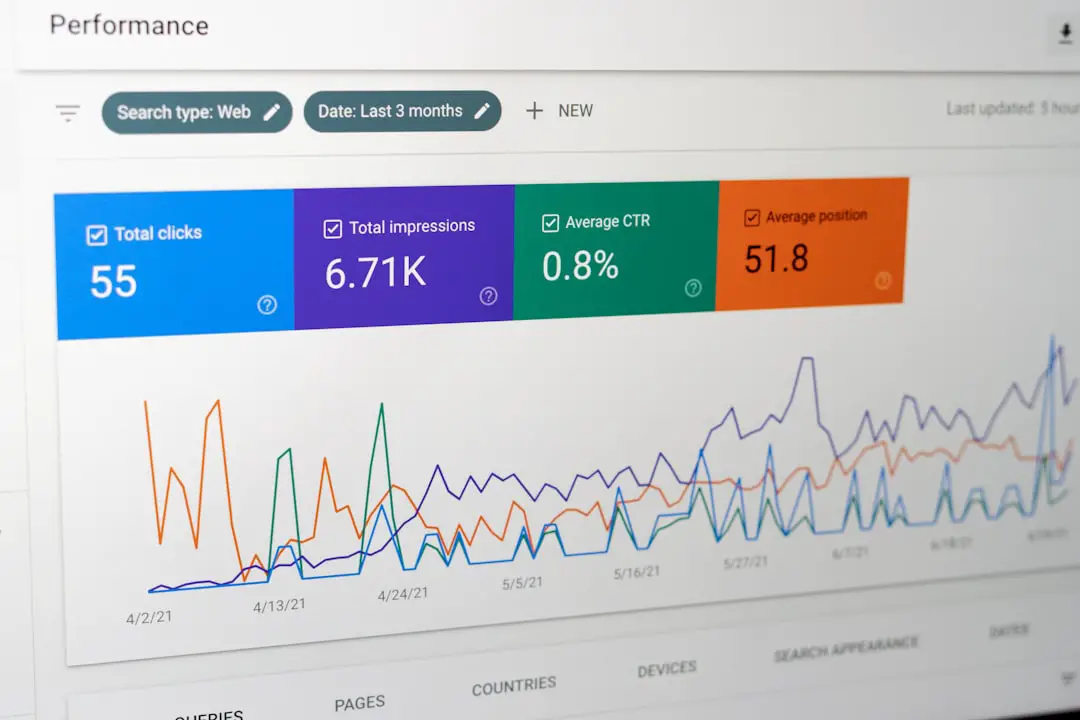
1. Real-Time Metrics Monitoring
Metrics are the foundation of operational awareness. Observability platforms offer:
- Custom dashboards with real-time graphs
- Threshold-based and anomaly-based alerts
- Infrastructure and container monitoring
- Cloud provider integrations
2. Centralized Log Management
Instead of combing through server files manually, teams can:
- Aggregate logs across services
- Search and filter logs instantly
- Create alerts based on log patterns
- Apply retention and indexing policies
3. Distributed Tracing
Tracing helps diagnose performance bottlenecks in microservices environments by:
- Mapping service dependencies
- Visualizing request paths
- Identifying slow spans and errors
- Measuring latency across services
4. Unified Dashboards and Correlation
The true value lies in correlating telemetry data. Many tools allow users to click from a metric spike directly into logs and traces associated with that event.
Leading Observability Platforms
While Datadog remains one of the most recognized names in observability, it’s not alone. Several strong competitors offer similar capabilities with different strengths and pricing models.
1. Datadog
Datadog is known for its:
- Extensive integrations (600+ technologies)
- Highly customizable dashboards
- Strong APM and distributed tracing
- Cloud-native and container monitoring features
It is especially popular among SaaS companies and DevOps-driven teams.
2. New Relic
New Relic offers a full-stack observability platform with:
- Unified telemetry data model
- Strong developer-focused monitoring
- Advanced application performance monitoring (APM)
- Generous free-tier limits
3. Dynatrace
Dynatrace emphasizes:
- AI-driven anomaly detection
- Automatic service discovery
- Deep enterprise monitoring
- Root cause analysis automation
4. Splunk Observability Cloud
Built on Splunk’s strong log management foundation, this platform provides:
- Advanced log analytics
- Infrastructure and APM monitoring
- Real-time streaming analytics
- Strong compliance capabilities
5. Grafana Cloud
Grafana Cloud extends the popular open-source Grafana ecosystem with:
- Prometheus metrics
- Loki logs
- Tempo distributed tracing
- Flexible visualization tools
Comparison Chart
| Platform | Best For | Strengths | Complexity |
|---|---|---|---|
| Datadog | Cloud-native teams | Extensive integrations, unified dashboards | Moderate |
| New Relic | Developers and startups | Strong APM, flexible pricing | Moderate |
| Dynatrace | Enterprises | AI automation, deep root cause analysis | High |
| Splunk | Log-heavy environments | Advanced log analytics | High |
| Grafana Cloud | Open-source enthusiasts | Customization, cost control | Variable |
The Business Value of Observability
Investing in observability is not just about debugging errors—it directly impacts business outcomes. Some of the key benefits include:
- Reduced downtime: Faster root cause analysis means shorter outages.
- Improved performance: Continuous monitoring reveals optimization opportunities.
- Better customer experience: Proactive issue detection prevents user-facing disruptions.
- Faster innovation: Teams deploy confidently knowing they have visibility.
In competitive markets where seconds of downtime can cost thousands—or millions—of dollars, observability becomes a strategic advantage.
Challenges in Implementing Observability
Despite their benefits, observability platforms present challenges:
- Data overload: Massive telemetry volumes can overwhelm teams.
- Cost management: Pricing often scales with data ingestion.
- Configuration complexity: Setting up meaningful dashboards and alerts requires careful design.
- Telemetry standardization: Teams must instrument applications correctly.
To address these challenges, many teams adopt open standards like OpenTelemetry, which standardizes metrics, logs, and traces across vendors.
Image not found in postmetaBest Practices for Using Observability Tools
Simply installing an observability platform is not enough. To maximize value:
- Define Service Level Objectives (SLOs) to align monitoring with business goals.
- Use anomaly detection instead of static thresholds where possible.
- Correlate telemetry data to reduce context switching.
- Train teams on reading traces and logs effectively.
- Continuously refine dashboards to eliminate noise.
Observability should become part of the development lifecycle, not an afterthought.
The Future of Observability
The observability landscape continues to evolve. Key trends include:
- AI-powered insights: Machine learning models automatically detect anomalies and predict incidents.
- Security observability convergence: Combining security and performance telemetry.
- Edge and IoT monitoring: Extending visibility beyond centralized cloud environments.
- Cost observability: Monitoring infrastructure costs alongside performance metrics.
As systems become increasingly complex, observability platforms must deliver deeper insights with less manual effort. The future lies in automation, predictive intelligence, and seamless integration with DevOps workflows.
Final Thoughts
Observability platforms like Datadog have become essential tools for modern engineering teams. By unifying metrics, logs, and traces in a single ecosystem, they empower organizations to move from reactive firefighting to proactive system optimization.
Whether you choose Datadog, New Relic, Dynatrace, Splunk, or Grafana Cloud, the goal remains the same: gain actionable insight into your systems before customers feel the impact. In a world where digital experiences define brands, observability is no longer optional—it’s foundational.